How do I interpret market indices like NIFTY and SENSEX?
 By Anita Singh
Market indices like NIFTY and SENSEX act as the barometers of the Indian economy. They help investors, traders, and policymakers gauge overall market sentiment and corporate performance. Interpreting these indices involves understanding their calculation, movements, global influences, and practical applications in investing. This comprehensive guide breaks down NIFTY and SENSEX with real-life examples, FAQs, and actionable insights for anyone looking to decode the stock market.
What Are Market Indices Like NIFTY and SENSEX?
In simple terms, a market index is a tool that measures the performance of a group of selected stocks. When you hear news anchors say “the market is up today,” they are usually referring to indices like NIFTY or SENSEX.
SENSEX (Sensitive Index): Tracks the performance of 30 large, well-established companies listed on the Bombay Stock Exchange (BSE).
NIFTY 50: Tracks 50 major companies listed on the National Stock Exchange (NSE).
Together, these indices serve as benchmarks of the Indian stock market, reflecting the confidence (or fear) of millions of investors. They are not just numbers—they mirror India’s economic pulse.
How Are NIFTY and SENSEX Calculated?
Both indices use a free-float market capitalization weighted method. This means the bigger a company is (in terms of market value), the more influence it has on the index.
Here’s how it works:
Market Cap = Stock Price × Number of Shares Available to Public (Free Float).
Companies with higher market caps carry greater weight in the index.
Example:
If Reliance Industries rises by 2%, it can push the entire index significantly upward.
If a smaller company like Dr. Reddy’s rises by 2%, the overall index impact will be much smaller.
That’s why NIFTY and SENSEX don’t perfectly mirror every stock’s movement—they reflect the weighted average of India’s largest corporations.
Why Are NIFTY and SENSEX Important to Investors?
Indices help investors and analysts in many ways:
Benchmarking Performance: Mutual funds and ETFs compare their returns against NIFTY or SENSEX.
Market Sentiment Gauge: If indices are rising, optimism is in the air; if falling, fear dominates.
Decision-Making Tool: Retail traders look at indices before buying or selling stocks.
Economic Health Indicator: Policymakers see indices as a snapshot of economic performance.
Real-Life Example: When SENSEX touched 50,000 points in early 2021, it became a symbol of India’s post-pandemic resilience and fueled positive investor confidence.
What Does It Mean When NIFTY or SENSEX Rises or Falls?
When Indices Rise: It reflects optimism. Investors expect higher corporate earnings, favorable government policies, or strong GDP growth.
When Indices Fall: It reflects fear. Reasons may include inflation, poor earnings, geopolitical issues, or global slowdowns.
Case Example: When the Indian Union Budget 2024 announced tax benefits for green energy, both indices surged. On the other hand, during the 2022 global oil price surge, indices fell sharply because higher import costs threatened India’s economy.
How Do Global Markets Influence Indian Indices?
The Indian stock market doesn’t operate in a bubble—it’s deeply influenced by global factors.
US Markets: If Dow Jones or Nasdaq plunges overnight, Indian indices usually open lower the next morning.
Crude Oil Prices: Since India imports most of its oil, rising oil prices hurt indices.
Currency Fluctuations: A weaker rupee can drag indices down, especially for import-heavy industries.
Geopolitical Events: Wars, global recessions, or US Fed interest rate hikes ripple into Indian indices.
Example: In March 2020, COVID-19 caused global panic. SENSEX crashed 3,000 points in one day, its steepest fall in decades, mirroring the world’s fear.
How Do You Read Daily NIFTY and SENSEX Movements?
Financial news always reports:
Opening Value: Where the index starts in the morning.
Closing Value: Where it ends after trading hours.
High/Low: The day’s trading range.
Example: If SENSEX opens at 65,000, dips to 64,200, but closes at 65,500, it suggests bullish momentum—the market recovered from losses and closed strong.
What Are Sectoral Indices and Why Do They Matter?
Besides headline indices, India tracks sector-specific indices like:
NIFTY Bank
NIFTY IT
NIFTY Pharma
NIFTY FMCG
These tell us how industries perform independently.
Example: If NIFTY IT rises while SENSEX falls, it means technology stocks are thriving even when the overall market is weak. Investors often rotate funds between sectors to chase growth.

How Can Retail Investors Use NIFTY and SENSEX?
For everyday investors, indices are practical tools:
Spotting Market Trends: If indices rise steadily, it indicates bullish markets; sharp declines suggest bearishness.
ETF & Index Fund Investing: Investors can buy NIFTY 50 ETFs or index funds to own a basket of top companies without stock-picking.
Avoiding Panic: Long-term investors use indices as reassurance that markets recover over time.
Example: Despite heavy crashes in 2008, 2020, and 2022, both indices bounced back to all-time highs. This proves the strength of long-term investing in index-based strategies.
Common Misinterpretations About Indices
“If NIFTY falls, all stocks fall.” False. Many stocks rise even when indices dip.
“High index = overpriced stocks.” Not always. Highs can reflect strong fundamentals.
“Indices predict the future.” Wrong. They show current market sentiment, not guaranteed outcomes.
FAQs on Interpreting NIFTY and SENSEX
Q1. How do beginners understand NIFTY and SENSEX? Beginners can start by regularly tracking the daily opening, closing, and movement of NIFTY and SENSEX on financial news platforms or official stock exchange websites. Reading news updates about global markets, crude oil prices, and economic policies helps understand why indices rise or fall. Beginners should also follow sectoral indices like NIFTY IT or NIFTY Bank to see how industries perform. Over time, observing trends develops a clearer understanding of market psychology and economic linkages.
Q2. Which is better to follow—NIFTY or SENSEX? Both indices are valuable, but they differ slightly. SENSEX includes 30 well-established companies, making it a strong historical and iconic indicator of Indian market health. NIFTY covers 50 companies across diverse sectors, offering broader representation of the economy. Investors often prefer NIFTY for its wider base, but SENSEX remains a reliable reference. Following both gives balanced insights, since weightage differences may cause occasional divergence. Beginners can track either index, but understanding both ensures better market interpretation.
Q3. Do foreign investors impact indices? Yes, foreign institutional investors (FIIs) play a huge role in India’s stock market. Large-scale buying by FIIs drives up demand for shares, boosting NIFTY and SENSEX. Conversely, heavy selling leads to sharp declines. Since India is an emerging market, it is sensitive to global capital flows, and FIIs often move money based on global interest rates, risk appetite, and currency strength. Monitoring FII activity provides useful clues about short-term trends and overall investor confidence in the economy.
Q4. Can I invest directly in these indices? You cannot buy NIFTY or SENSEX directly because they are indicators, not tradable assets. However, investors can participate through ETFs (Exchange Traded Funds), index mutual funds, or derivatives (futures and options) based on these indices. ETFs track the performance of the index, making them an easy, low-cost way to invest in India’s top companies without picking individual stocks. Index funds are popular among beginners seeking passive investing, while derivatives suit experienced traders managing risk or speculation.
Q5. Why do NIFTY and SENSEX sometimes move differently? NIFTY and SENSEX are similar but not identical. The key difference lies in the number of companies and their sectoral weightage. NIFTY includes 50 stocks, while SENSEX has 30. If IT-heavy companies gain, NIFTY may show more strength compared to SENSEX. Similarly, if banking or energy stocks dominate, SENSEX may move differently. Both track India’s economy but cover slightly different compositions. This explains why on some days, NIFTY rises while SENSEX either lags or shows smaller movements.
Q6. How do interest rates impact indices? Interest rates directly affect corporate borrowing costs and consumer spending. When central banks raise rates, loans become expensive, hurting profits of businesses and reducing investor appetite. As a result, NIFTY and SENSEX often fall. Conversely, lower interest rates stimulate growth by making borrowing cheaper, boosting demand and company earnings, which lifts indices. Foreign investors also move capital based on rate changes. Thus, interest rate decisions by the Reserve Bank of India (RBI) significantly influence overall market sentiment.
Q7. Do election results move markets? Yes, election results strongly impact NIFTY and SENSEX because they influence investor confidence and future policy direction. Political stability usually sparks rallies, as markets expect business-friendly reforms and continuity. Conversely, uncertainty, hung parliaments, or anti-market policies can trigger sell-offs. For instance, the 2019 general election results led to record highs in both indices as investors anticipated pro-growth measures. Markets react not only to results but also to campaign promises, government policies, and the stability of upcoming leadership.
Q8. How volatile can indices get in a day? On normal trading days, NIFTY and SENSEX move between 1–2%. However, during global crises or major announcements, volatility spikes sharply. For example, in March 2020 during the COVID-19 outbreak, indices fell nearly 10% in a single session—the steepest in decades. Election results, budget announcements, or global shocks like oil price surges also create huge swings. While such volatility may scare beginners, seasoned investors see it as opportunity. Understanding that markets recover over time helps avoid panic reactions.
Q9. Are these indices perfect indicators of India’s economy? NIFTY and SENSEX are strong economic barometers but not perfect. They represent the performance of India’s largest listed companies, mostly blue-chip firms. This means they capture trends in big industries like banking, IT, and energy but don’t reflect the health of small and medium enterprises or unlisted businesses that form a huge part of India’s economy. So, while indices signal overall investor confidence and corporate health, they cannot fully measure employment levels, rural demand, or informal economic activity.
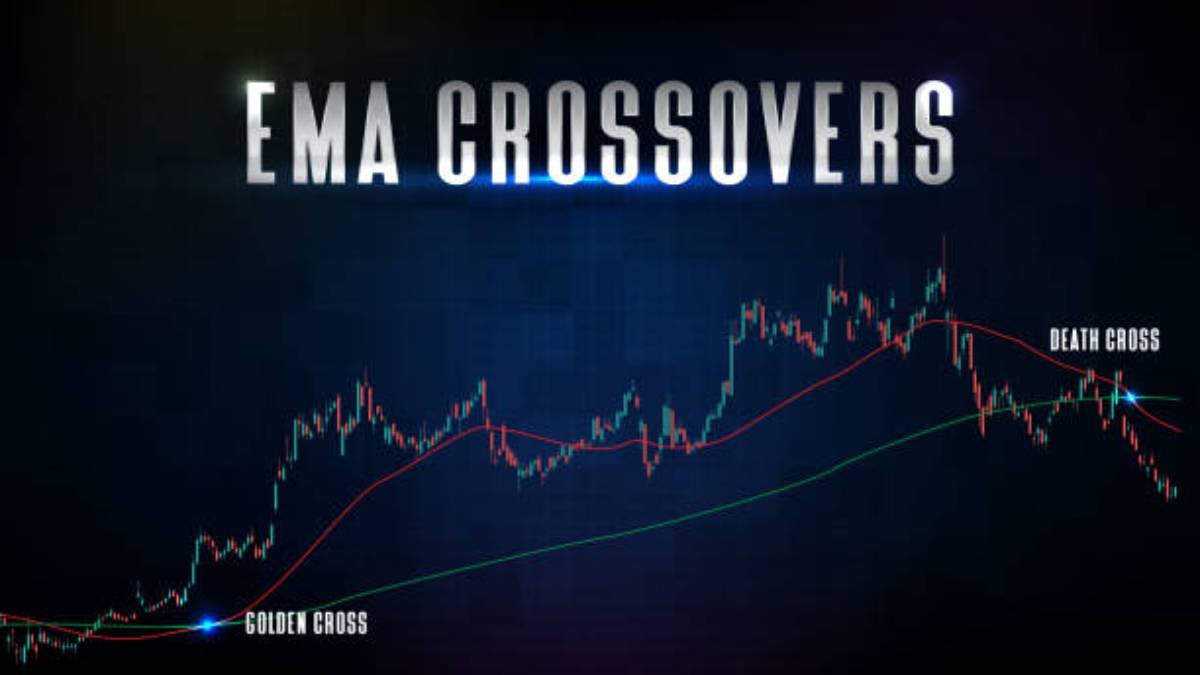
Q10. Can traders apply technical analysis to indices? Yes, traders frequently use technical analysis on NIFTY and SENSEX just like individual stocks. Popular tools include moving averages, support and resistance levels, Relative Strength Index (RSI), and candlestick patterns. These help identify market trends, entry points, and reversal signals. Many traders also use index charts for futures and options trading since indices are less volatile than individual stocks. Combining technical analysis with global news and sector performance offers a well-rounded strategy for predicting short-term index movements.
Key Takeaways
NIFTY and SENSEX are mirrors of India’s economy and market sentiment.
Short-term volatility is normal—focus on long-term growth.
Sectoral indices offer deeper insights into industry trends.
Global events have a huge influence—keep an eye on US markets, oil prices, and geopolitical news.
ETFs and index funds make it easy for beginners to invest in India’s top companies.
Their stories show us that whether you are a global football icon or a comedian with no words, success on social media comes down to relatability, creativity, and staying true to yourself.